We use cookies to ensure you get the best experience on our website. By continuing
to use our site, you accept our use of cookies, privacy policy and terms of service.
ESC
What are you looking for?
Subscribe to our Newsletter
Join 10k+ people to get notified about new posts, news and updates.
Terms of use dolor sit amet consectetur, adipisicing elit. Recusandae provident ullam
aperiam quo ad non corrupti sit vel quam repellat ipsa quod sed, repellendus
adipisci, ducimus ea modi odio assumenda.
Disclaimers
Lorem ipsum dolor sit amet consectetur adipisicing elit. Sequi, cum esse possimus
officiis amet ea voluptatibus libero! Dolorum assumenda esse, deserunt ipsum ad
iusto! Praesentium error nobis tenetur at, quis nostrum facere excepturi architecto
totam.
Lorem ipsum dolor sit amet consectetur adipisicing elit. Inventore, soluta alias
eaque modi ipsum sint iusto fugiat vero velit rerum.
Limitation on Liability
Sequi, cum esse possimus officiis amet ea voluptatibus libero! Dolorum assumenda
esse, deserunt ipsum ad iusto! Praesentium error nobis tenetur at, quis nostrum
facere excepturi architecto totam.
Lorem ipsum dolor sit amet consectetur adipisicing elit. Inventore, soluta alias
eaque modi ipsum sint iusto fugiat vero velit rerum.
Copyright Policy
Dolor sit amet consectetur adipisicing elit. Sequi, cum esse possimus officiis amet
ea voluptatibus libero! Dolorum assumenda esse, deserunt ipsum ad iusto! Praesentium
error nobis tenetur at, quis nostrum facere excepturi architecto totam.
Lorem ipsum dolor sit amet consectetur adipisicing elit. Inventore, soluta alias
eaque modi ipsum sint iusto fugiat vero velit rerum.
General
Sit amet consectetur adipisicing elit. Sequi, cum esse possimus officiis amet ea
voluptatibus libero! Dolorum assumenda esse, deserunt ipsum ad iusto! Praesentium
error nobis tenetur at, quis nostrum facere excepturi architecto totam.
Lorem ipsum dolor sit amet consectetur adipisicing elit. Inventore, soluta alias
eaque modi ipsum sint iusto fugiat vero velit rerum.
How Do You Prove ABM ROI to Leadership and the Board?
TLDR
ABM ROI proof is a meeting-preparation exercise, not a metrics one. Each stakeholder (board, CEO, procurement, renewal committee) needs a different artefact, and generic "here are your ABM metrics" guides miss this completely.
Build a bridge report with four data points: accounts targeted vs. engaged, engagement-to-meeting conversion, pipeline influenced, and spend per pipeline dollar.
If your stack requires manual stitching across five tools to produce this report, that reporting overhead is actively undermining the ROI it is supposed to prove.
Recotap gives demand gen teams account-level influence dashboards that connect ABM spend to pipeline, the proof leadership actually asks for.
Instead of stitching data across five tools manually, teams get a single report showing which accounts progressed, which campaigns influenced pipeline, and what the spend-to-pipeline ratio looks like.
Here is how to build the ROI artefact your board, your CEO, or your procurement committee needs to see, mapped to the exact meeting you are walking into.
You have a board meeting in five days. Your CEO asks a simple question: what did ABM produce this quarter? You open your laptop and start pulling data. LinkedIn Campaign Manager. Salesforce. Bombora. G2. Pardot. Somewhere between the third spreadsheet and the fifth tab, you realise you cannot connect any of it into a single story.
This is where most ABM ROI conversations break down. Not because the programme did not work, but because nobody built the right report before the meeting that demanded it. The problem is not the absence of data. It is the absence of a format built for a specific audience, answering the specific question that audience will ask.
Why Do Sales and Marketing Measure ABM Success Differently?
Sales leadership tracks meetings booked per week. Marketing tracks account progression: which accounts moved from unaware to engaged, from engaged to opportunity, how much pipeline ABM-touched accounts influenced. Neither metric alone answers what the board asks.
The disconnect becomes visible when the CEO issues the "link the spend back to sales" mandate. Only 29% of ABM teams are measured through ABM-aligned metrics. Gartner confirms 36% of marketers struggle to measure ABM ROI at all. The question is not which metrics to track. The question is which metrics to present, to whom, in what format, for what meeting.
What ABM Metrics Should You Report to Different Stakeholders?
What Does the Board Need to See?
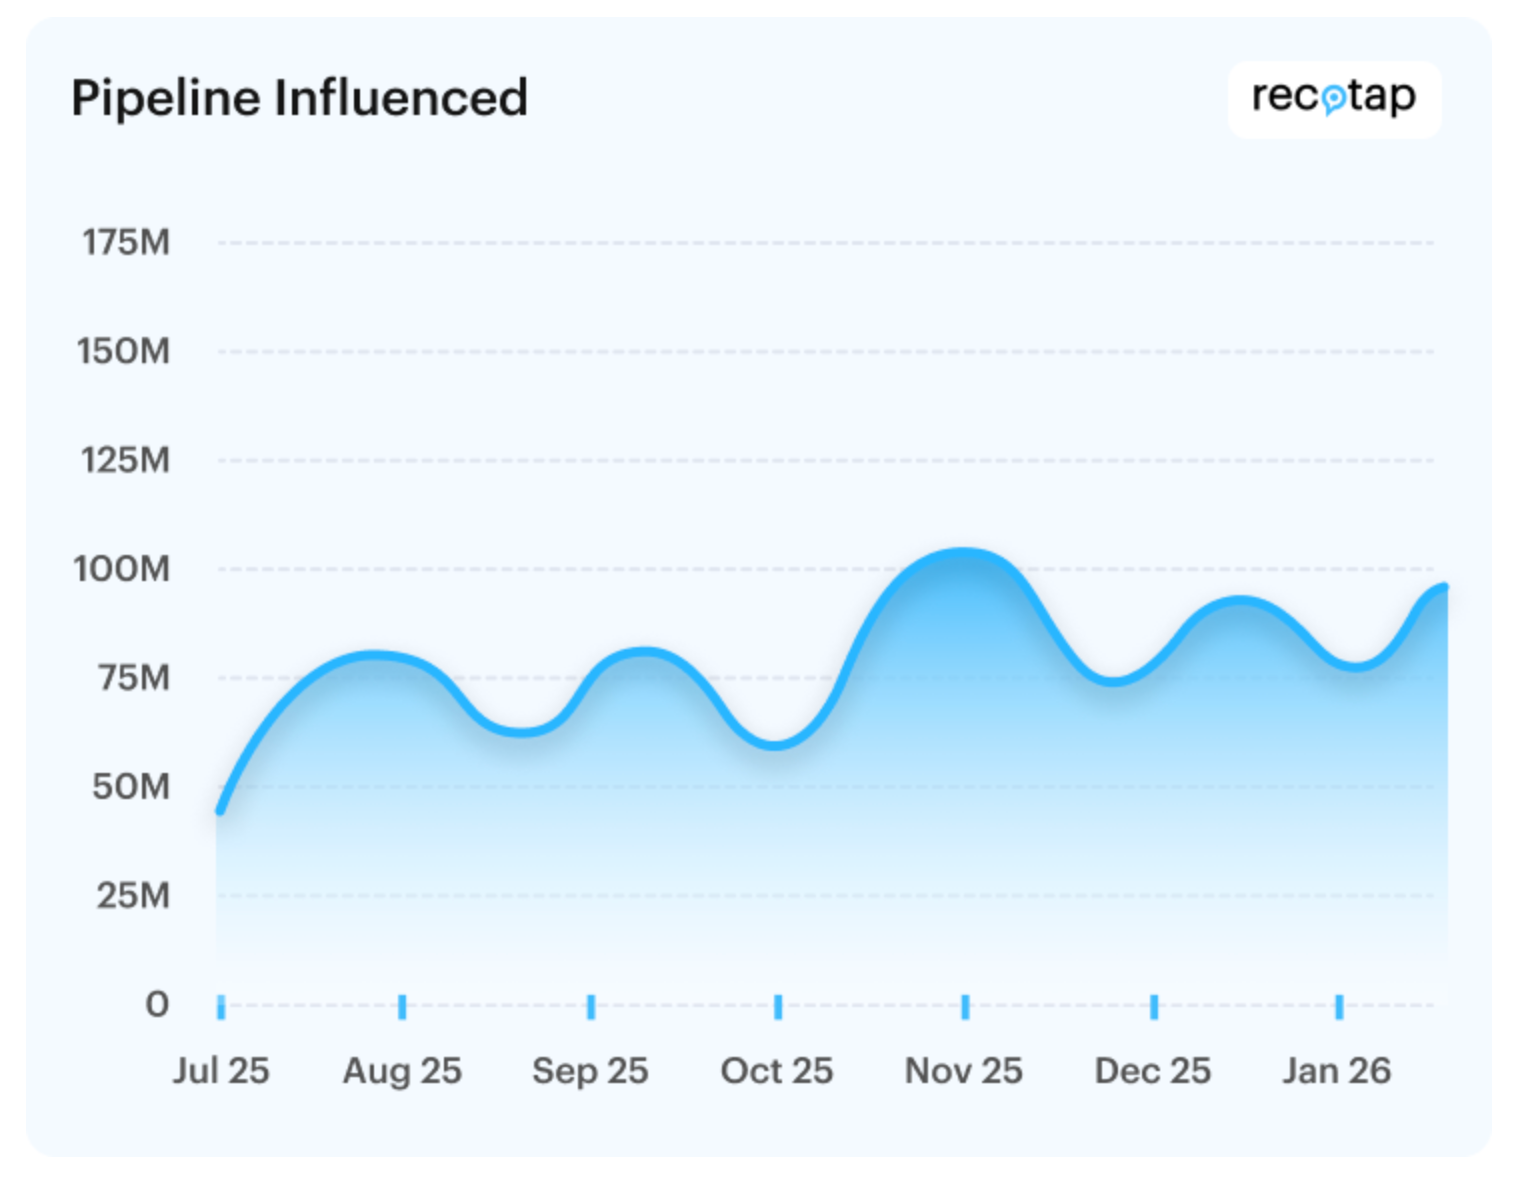
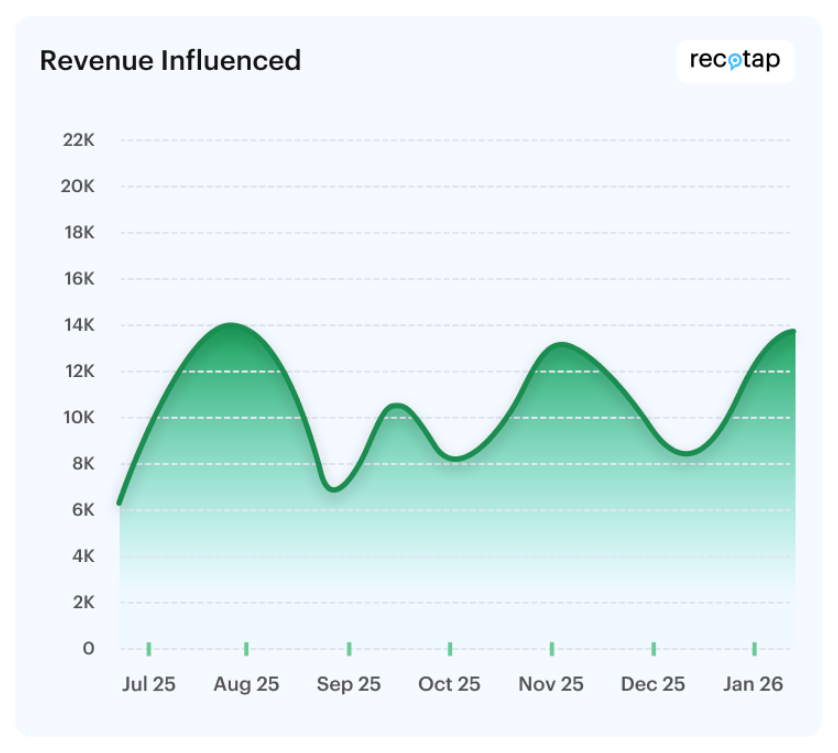
The board wants two numbers and a trajectory.Pipeline contribution (what percentage of total pipeline came from ABM-targeted accounts, as both a percentage and a dollar figure) and revenue influenced (closed deals where ABM engagement was part of the buying journey). The artefact they need is a one-page pipeline influence summary: accounts targeted, accounts that progressed stages, pipeline generated, and revenue closed. No click-through rates. No impression volumes.
Pipeline influenced using Recotap ABM campaigns
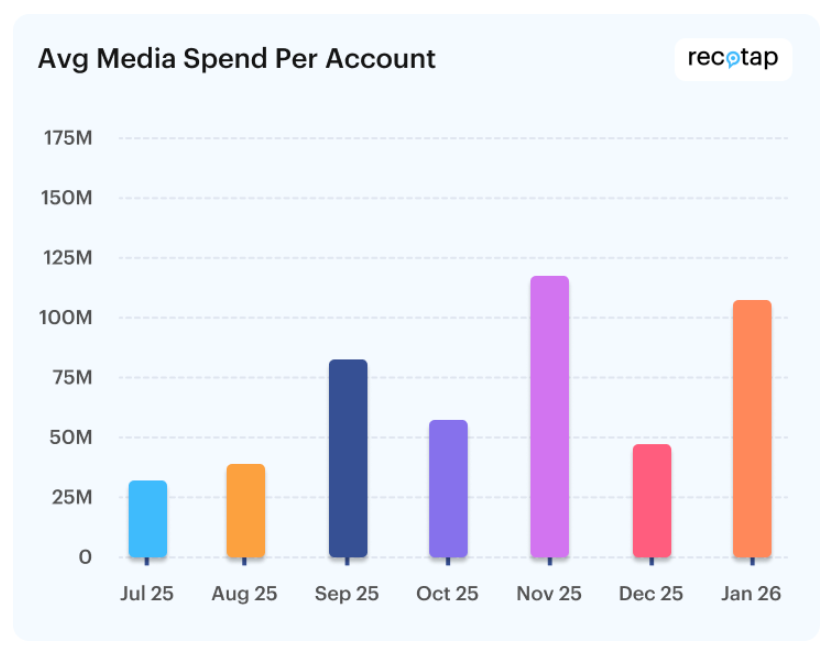
Average media spend on every account to drive pipeline
How Do You Defend ABM Spend in a Renewal Meeting?
The question is not "is ABM strategically valuable?" It is "should we keep paying for this?" The proof artefact is a before/after report: account engagement lift since ABM launch, pipeline velocity for targeted vs. non-targeted accounts, andCPL reduction. If your programme reduced CPL from $1,000 to $300 on targeted accounts, that single data point often carries the renewal.
What Does a Procurement Committee Need?
Procurement evaluates whether your specific vendor is the right choice, not whether ABM works. The proof artefact is a vendor comparison brief with case study evidence. Include the metric (pipeline generated, deal size, time-to-close), the mechanism (what the platform did that the previous approach could not), andwhat the investment costs to give the committee the full picture in one sitting.
How Do You Structure an ABM Pilot That Passes the Approval Gate?
When budget triggers management-level approval chains, typically at the $25K+ mark, pre-agree on success criteria before the pilot starts. The proof artefact is a 90-day pilot scorecard with three pre-agreed metrics: target account engagement rate, account stage progression, and pipeline generated from pilot accounts. Document these in writing before the pilot begins. When 90 days end, the conversation is not "did it work?" It is "did it hit the numbers we agreed on?"
How Do You Show a CEO That ABM Spend Links Directly to Sales?
The CEO mandate is the bluntest version: spend in, revenue out. The proof artefact is a media-spend-per-account report mapped against pipeline generated. If you spent $50K targeting 30 accounts and those accounts generated $1.2M in pipeline, that is a 24xspend-to-pipeline ratio. The CEO can work with that number.
How Do You Connect ABM Spend to Pipeline in a Single Report?
All five scenarios depend on the same underlying structure: a bridge report that translates ABM metrics into the language leadership already trusts.
Start with what leadership trusts: meetings booked, SQLs generated, pipeline created, revenue closed. Then layer on what ABM actually drives. For each trusted metric, show the ABM contribution. How many of those meetings were with ABM-targeted accounts? What percentage of SQLs came from accounts that received ABM engagement?
The four data points every bridge report needs:
Accounts targeted vs. accounts engaged, showing programme reach and whether targeting is working
Pipeline influenced by ABM-touched accounts, expressed as both a dollar figure and a percentage of total pipeline
Media spend per pipeline dollar, the efficiency metric the CEO needs to see
When these four data points sit in a single view, the reader does not need to translate between marketing language and sales language. Recotap's account-level influence dashboards generate this bridge report natively, without manually stitching data from LinkedIn, your CRM, your intent provider, and your marketing automation tool.
Does Reporting Overhead Undermine the ROI It Is Supposed to Prove?
Yes. The demand gen leader running ABM is typically also the person responsible forproving it works. That means the same person executing campaigns and optimising creative is also pulling data from five platforms, building attribution spreadsheets, and formatting the board deck. Every reporting cycle, this manual process consumes hours that could have been spent building better audiences, launching new campaign stages, and coordinating sales follow-up.
The fix is not more dashboards. There are fewer manual data pulls. Platform-level attribution, where your ABM tool tracks account engagement, stage progression, and pipeline influence natively and syncs to your CRM, eliminates the manual stitching. The report that took a full day to build every quarter should be available on demand, updated daily.
How Do You Get ABM Budget Approved After a Previous Platform Failed?
If your organisation tried a prior ABM platform and the results did not materialise, the proof bar for the next tool is significantly higher. The framework that works has four steps:
Pre-agree on three success metrics before the pilot starts: account engagement rate, pipeline progression, and revenue generated from pilot accounts. Get these in writing.
Set a 90-day evaluation window, enough to show account-level movement without asking for a leap of faith.
Use account progression as the primary indicator, not lead count. Lead count is the metric that made the previous tool look like it was working when it was not.
Present results in bridge report format: accounts targeted vs. engaged, engagement-to-meeting conversion, pipeline influenced, and spend per pipeline dollar.
Key Takeaways
ABM ROI conversations fail because sales measures meetings booked while marketing measures account progression, and neither metric alone answers what the board asks
Five specific meetings test ABM ROI proof: board reviews, renewal meetings, procurement committees, pilot gates, and CEO mandates, each requiring a different report format
The bridge report translates ABM metrics into leadership language using four data points: accounts targeted vs. engaged, engagement-to-meeting conversion, pipeline influenced, and media spend per pipeline dollar
Reporting overhead from manual data stitching is the hidden tax that undercuts the time available to produce actual ROI
After a prior ABM tool failure, structure a 90-day pilot with three pre-agreed success metrics and present results in bridge report format
If your team is evaluating whether Recotap fits your ABM programme and reporting needs,talk with our expert here.
Frequently Asked Questions
Q: How do you measure ABM ROI?
ABM ROI is measured by connecting programme spend to pipeline and revenue from targeted accounts. The core formula is a pipeline influenced by ABM-touched accounts divided by total ABM spend. Most teams need account-level influence tracking to calculate this accurately.
Q: What ABM metrics should I report to the board?
Report pipeline contribution (as both a percentage and a dollar figure), revenue influenced (closed deals where ABM engagement was part of the journey), and spend-to-pipeline ratio. Boards do not need engagement scores or impression volumes.
Q: How long does ABM take to show ROI?
Most programmes need 6 to 12 months to show measurable pipeline impact. Early indicators appear within 90 days: account engagement lift, stage progression, and increased meeting rates with targeted accounts.
Q: How do you prove ABM influenced the pipeline?
Track which accounts received ABM engagement and measure how many entered pipeline. If targeted accounts convert at a higher rate, show higher deal velocity, or generate larger deal sizes compared to non-ABM accounts, that is measurable influence.
Q: How do you justify ABM spending to a CEO?
Build a media-spend-per-account report showing total investment against pipeline generated from targeted accounts. Supplement with a before/after comparison of pipeline velocity and CPL for targeted vs. non-targeted accounts.